This post was authored by Megan Miller of the Deltek Vision marketing team—follow her on Twitter.
No one walks into a strategic planning meeting and says “I want to lay off people this year and focus on losing money.” But, with so many metrics, KPIs, and numbers, it’s hard to keep on top of performance if you don’t know which ones matter the most. Whether you are new to one of the many niches in the professional services industry or are a veteran in your field, income statements and key financial metrics might just look like a jumbled mess of numbers and symbols.
All data facts and figures referenced in this blog post come from the 36th Annual Deltek Clarity A&E Industry Study. This report surveys hundreds of architecture and engineering (A&E) firms each year in North America to set benchmarks for firm project management, financial, and business development performance. This post looks at the top 3 income statement KPIs you should be monitoring at your professional services firm.
1. Utilization Rate
The utilization rate measures the percentage of total staff labor charged to billable projects. In 2014, the average utilization rate inched up just slightly to 60% with half of the participants showing rates between 55% and 65%. Over the past three years, the utilization rate has flattened out a bit. 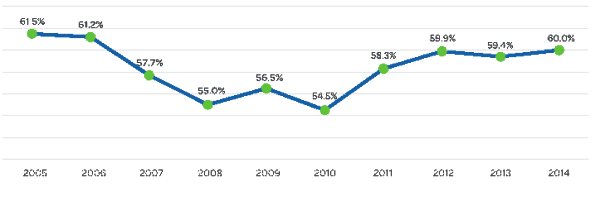 At a high level, overall utilization shows you how billable your firm is as a whole. But, when you track and monitor trends within your firm by year, quarter or month, you will begin to see challenges that may be impacting your bottom line.
- Do you have one profit center consistently over-utilized and another underutilized?
- Are there opportunities for cross training to spread the burden?
- Do project managers always tap into the same resources?
- Who is managing the overall picture for your firm’s resources to maximize utilization?
- Are trends in utilization telling you that you have too much or not enough of a particular skill set?
For clarification purposes, the utilization rate is calculated by dividing the cost of direct labor (labor charged to projects) by the total labor cost of the firm, and multiplying by 100.
Related article: Project Management and Positive Impacts on the Bottom Line
2. Net Labor Multiplier
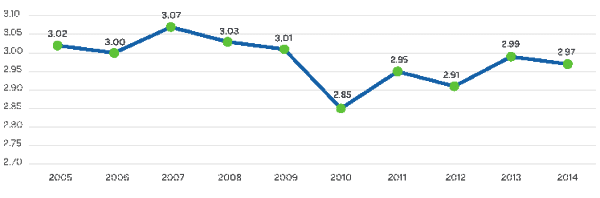
High performing firms strive to generate the most revenue possible with the least amount of labor costs. To monitor their effectiveness, firms track the net labor multiplier or the amount of money a firm brings in per dollar spent on direct labor. Typically the net labor multiplier and utilization rate work in opposition; this year it is no different. The net labor multiplier went down ever so slightly in 2014 from 2.99 to 2.97. The numbers here have leveled off in the past three years as well, indicating that firms are settling into a new normal of productivity.
Often times, firms look to increase billing rates to impact their net labor multiplier, but in this highly competitive market, increasing billing rates is not always feasible. However, with creativity and ingenuity, firms can work to increase the value generated by each labor dollar.
- Are you measuring variances in production on similar projects?
- Are your project managers actively managing earned value throughout each project?
- Are your employees maximizing their efficiency and revenue contributions?
- Are your teams looking for ways to streamline and automate typical design processes to reduce labor costs?
- Are your project being managed and planned effectively?
The Deltek Clarity A&E Industry study calculates net labor multiplier by dividing net revenue by direct labor, the cost of labor charged to projects.
3. Overhead Rate
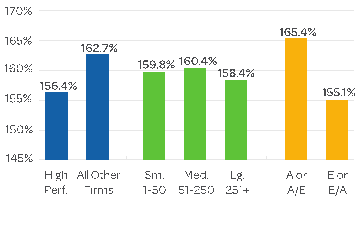
One of the most critical financial metrics for an A&E firm, the overhead rate, measures your non-billable costs compared to your billable costs. These non-billable costs can include non-billable professional hours, facilities costs and corporate expenses to name a few. For the fourth year in a row, we see a decrease in overhead rate across the industry with an average rate of 160%. The rates were relatively consistent across all firm sizes this year with 159.8% for firms with 1-50 employees, 160.4% for firms with 51-250 employees and 158.4% for firms with more than 250 employees. And, the overhead rate for engineering firms was significantly lower than architecture firms this year.
 If your overhead rate is higher than desired, the first thought might be to cut overhead positions or reduce “unnecessary costs,” but firms need to find the right balance. Continuing to improve utilization while monitoring corporate overhead and benefit expenses over time can help make smarter, more informed decisions.
- Is your firm creatively cross-utilizing staff between profit centers and projects?
- Does your firm document how non-billable time is spent?
- Do you re-evaluate benefit providers and costs annually?
- Have you budgeted for overhead staff necessary to support your growth initiatives?
- Is employee turn-over driving up overhead costs?
The overhead rate is calculated by dividing total overhead (before bonuses) by total direct labor expense, times 100.
More Key Financial Metrics
These are just three of the key financial metrics included in the study that your firm should be monitoring regularly and benchmarking against other firms. By benchmarking, you can find your bright spots and areas for improvement. Here are a few other key metrics to help check the health of your firm and reach your strategic goals:
- Revenue per Employee – up again this year, the average revenue per employee is $129,689, not accounting for inflation
- Operating Profit on Net Revenue – generally the preferred measure for an A&E firm’s profit rate, the operating profit on net revenue is 11.8% this year, a five-year high, with still more room to grow to regain the previous high-water marks
Related article: Top 3 Most Important Balance Sheet Ratios for Professional Services Firms[/fusion_builder_column][/fusion_builder_row][/fusion_builder_container]