We wanted to give a big Thank You to everyone who made it out to the Deltek Clarity A&E Industry Luncheon we held yesterday in Houston, Texas. Executives, Principals, and key decision makers from more than 40 firms were in attendance to learn about the state of the AEC industry in Texas. If you’re a licensed CPA and need CPE credit for this event, please take this short survey and we’ll issue your credits as soon as possible. The purpose of this blog post is to provide a recap of Tim Rochette’s presentation on the Deltek Clarity Report. The slides used during this presentation are at the very end of this article.
If you’re interested in attending one of our Deltek Vision User Group Meetings, we’ll be covering Year-End Processes and Procedures this December in Baton Rouge, LA; Honolulu, HI; Houston, TX; San Antonio, TX; and San Diego, CA. More information
Deltek Clarity A&E Industry Study
The Deltek Clarity A&E Industry Study is an annual report that surveys and establishes a benchmark for Architecture & Engineering firms in North America. Deltek’s industry expert, Tim Rochette, shared some interesting insight based on 2014 data collected this year’s report. The survey had more than 500 A&E firms participate – just over 10% of Deltek Vision users. Engineering firms made of 63% of the participation pool with architecture firms trailing at 28%. Participants also ranged in size with 45% of the respondents having 1-50 employees, 44% having 51-250 and the remaining 11% having greater than 250 employees.
Some of his key observations from the study included a strong US dollar coupled with low oil prices contributed significantly to growth in the A&E market and led to a sort of engineering and manufacturing renaissance throughout much of the country. We also saw a shrinking wage gap, the return of employee benefits and bonuses, battles being fought over talent acquisition, and more women in leadership positions than ever before in the sector. Unsurprisingly we also observed companies and startups reducing their IT expenditures and flocking to the cloud. Throughout the U.S. and especially in Texas we’ve witnessed the return of subdivisions and housing markets, in the west we’re seeing the emergence of the highly lucrative engineering and architecture of highly secure marijuana warehouses.
Texas Public Sector AEC Market Overview
San Antonio is still the largest benefactor of federal AEC contracts in Texas with $904 million with an additional $825 million in funding at Lackland AFB, also located in San Antonio from 2011-2015. Construction in support of the San Antonio Military Medical Center (SAMMC) at Fort Sam Huston Clark/Hunt JV, drove a majority of the spending in San Antonio. The USACE has a contract being fulfilled by Skanska to build the Lackland Ambulatory Care Center (LACC), which is being be completed in four separate phases for all four wings, or buildings, of the ACC. The LACC consists of four buildings, a multi-story parking garage and a Central Energy plant.
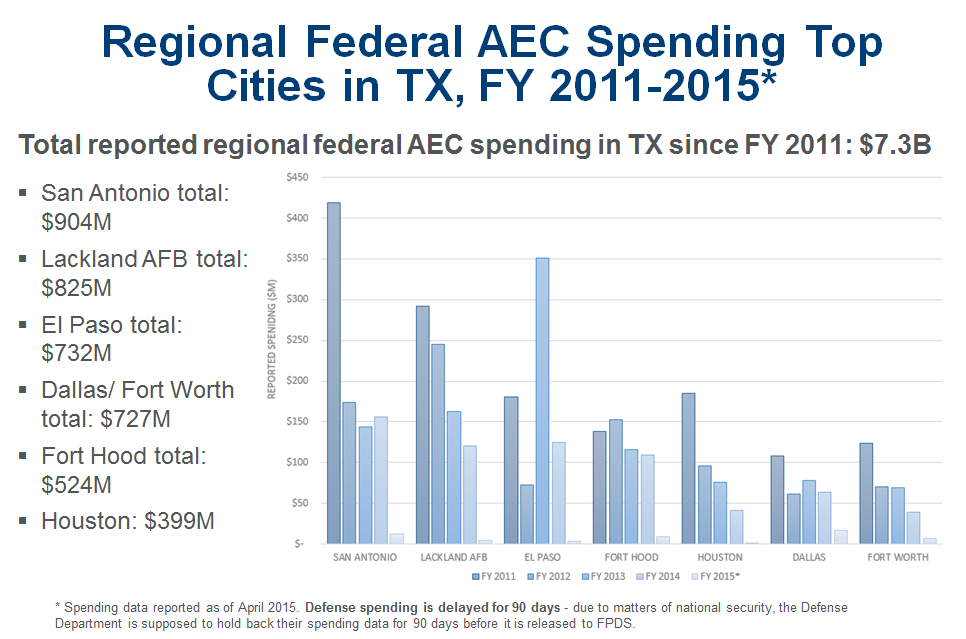
El Paso (Fort Bliss) reported spending in FY13 attributed to phase 6 of the U.S. Army Corps of Engineers (USACE) requirement for construction services in support of the hospital replacement project on Fort Bliss, Texas. Congress allotted $946 million for construction of the 135-bed, four-building hospital complex. This effort is one of the largest single construction projects on Fort Bliss, and comes on the heels of the recently completed $4.9 billion expansion of the Army post, which included a long list of new facilities. The $946 million value is inclusive of the hospital equipment, road work and construction.
In Dallas/ Ft Worth, the largest spending Federal departments for AEC are:
- Army – $280M
- VA – $125M
- GSA $89M
- EPA – $87M
One of the federal AEC contracts with the most reported spending in Dallas is with CH2M Hill out of the EPA for superfund cleanup ($86M for the reporting period) the second is out of GSA for managed services for the storage of pharmaceuticals ($41 million) held by Life Science Logistics, LLC.
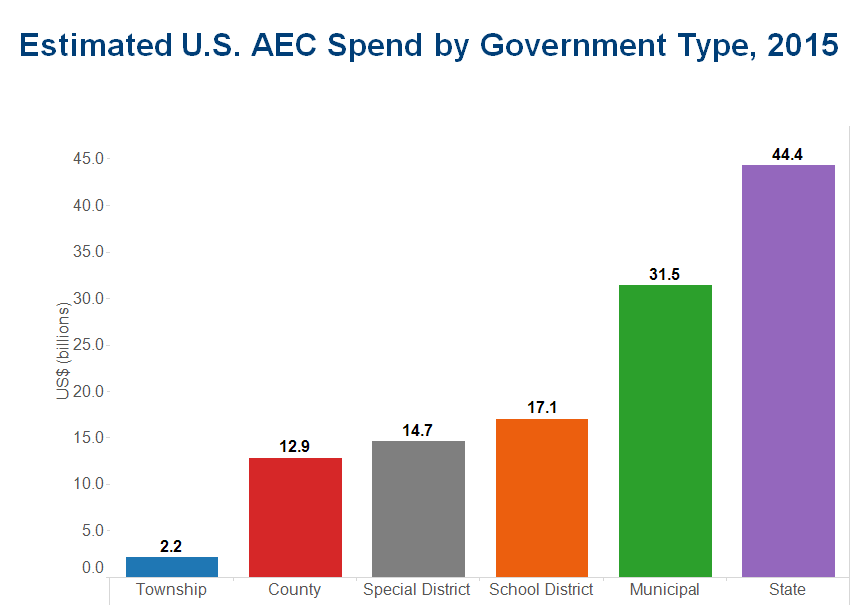
Based on U.S. census data, Deltek classifies Texas’ population growth as very robust with most growth concentrated in the metro areas of east and central Texas. State and county-level spending on transportation infrastructure is estimated at nearly $2B for 2015. Those entities will not spend on public utility; instead, municipalities and special districts will focus on both transportation and public utilities.
Deltek classification definitions:
- Public Utility includes sewage/dry waste, waste water, water supply, gas supply, and power supply plants, pumps, and line infrastructure.
- Transportation includes air, land, and water passenger/cargo terminals as well as runways, highway/toll roads, transit lines, and dock/marina infrastructure.
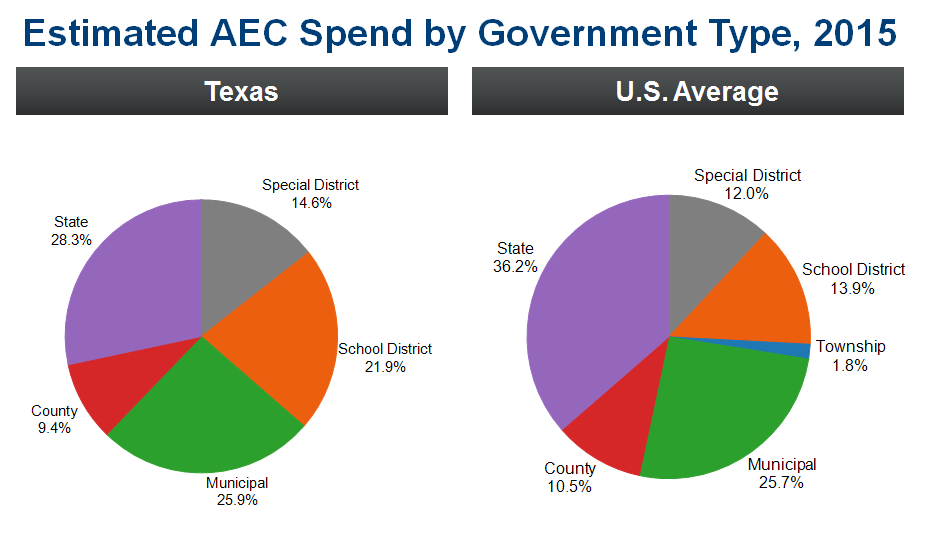
Another interesting statistic from this study is that Texas’ estimated AEC spend by school districts is 21.9% compared to a 13.9% national average. Estimates of AEC spend at the public-service level will have a large focus on higher education at state level and primary education within school districts.
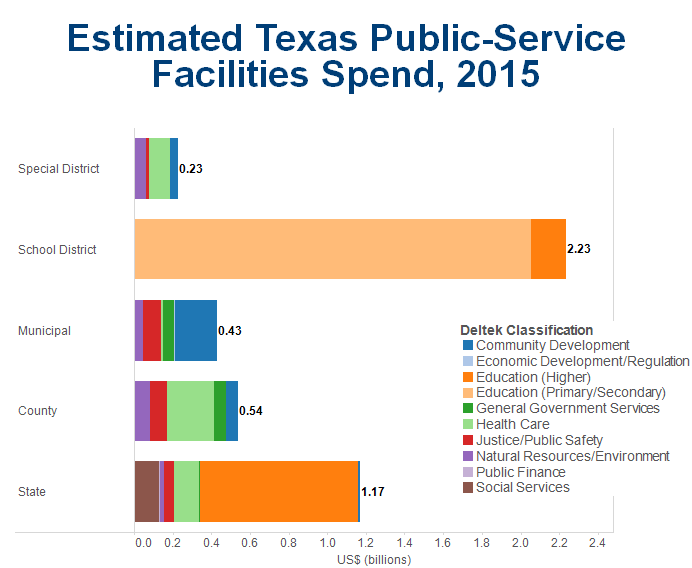
Estimates of AEC spend at the public-service level will have a large focus on higher education at state level and primary education within school districts.
Estimates were created by Deltek using U.S. Census bureau data sources.
Deltek classification definitions:
- Community Development includes residential, libraries/archives, sports, performance/meeting, social/neighborhood, and park/camp recreational facilities.
- Economic Development/Regulation includes office facilities for protective inspection and regulatory activities.
- Education (Higher) includes campus instructional, dormitory, and sports/recreation facilities as well as dedicated campus-area infrastructure.
- Education (Primary/Secondary) includes elementary, middle/junior, and high school instructional and administrative facilities.
- General Government Services includes central staff office facilities.
- Health Care includes hospital, medical building, and special care facilities.
- Justice/Public Safety includes correctional/detention, police sheriff, and fire/rescue facilities.
- Natural Resources/Environment includes office facilities for administering conservation and development infrastructure.
- Public Finance includes office facilities for administering liquor store, parking garage, and other commercial activities.
- Social Services includes office and residential facilities for welfare and veterans services.
National Financial Performance KPIs
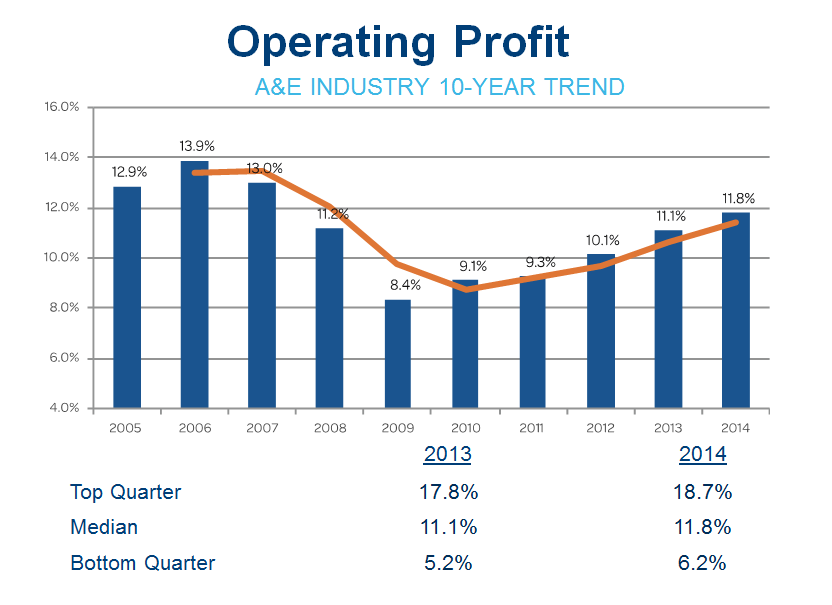
Operating profit – pre-tax, pre-distribution profit divided by Net Revenue – continues to climb and is at a high since the downturn of the market in 2008-2009, but we still have yet to reach pre-recession levels. On average we’re seeing 6% year-over-year (YOY) top-line growth across the board. The sustainability of this growth is still unclear.
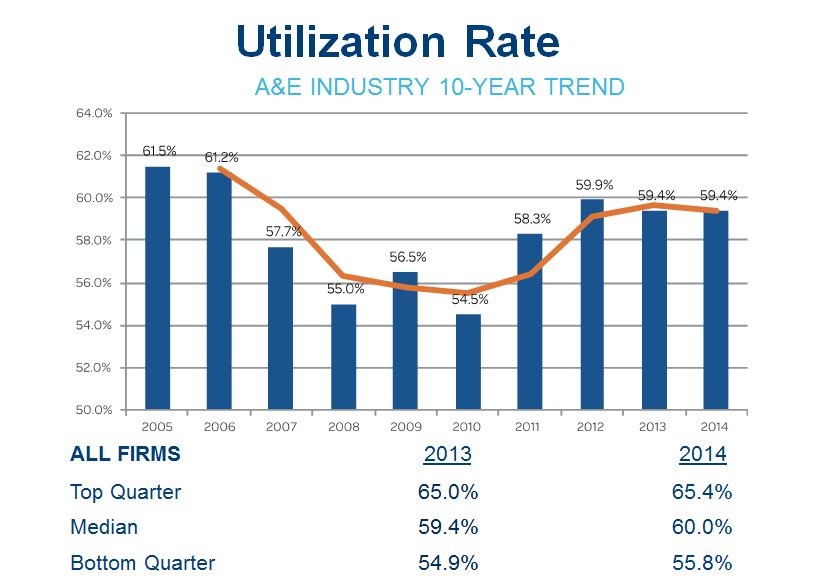
Utilization rates – direct labor dollars (labor charged to projects) divided by Total Labor dollars – seems to have flat lined at 59.4% though they still appear to be stable from a YOY perspective. This is another indicator that the overall increase in in operating profit is top-line growth, rather than cutting overhead.
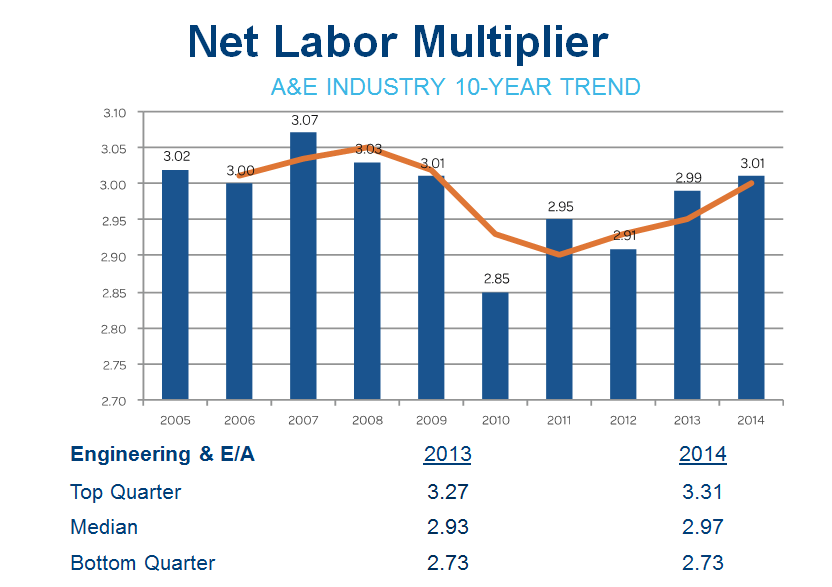
Net Labor Multiplier – Net Revenue divided by Direct Labor – is back above 3.0, but only barley. Segmentation between industries also only reflects minor shifts in the market. This is still a positive sign since we’re back at pre-recession levels here. There was no statistical difference in the Net Labor Multiplier between firm sizes.
See also:
- Top 3 Income Statement KPIs for Professional Services Firms
- Top 3 Most Important Balance Sheet Ratios for Professional Services Firms
National Business Development KPIs
We are seeing more dedicated business development staff in the industry, but still seeing a significant number of companies leveraging Project managers for business development. This is a key aspect of staff development and training for future success of businesses (succession planning beyond the CEO).
Major challenges to business development in the industry are not surprising either with most firms pointing to increased competition, not finding enough time to manage client relationships, and limited business development resources/time. There never seem to be enough hours in the day to get it all done effectively, especially when your primary sales people and marketers ae your executive team and PMs.
One interesting statistic from the Clarity Report asked if firms had a formal go/no go process. The responses seemed to be pretty well spread out. What we want to take a look at in our analysis is to see if there is a correlation between win rates and go/no go processes. How does this impact firms? Does it help them be more successful? We think so, but we want to see if the data supports that.
For detailed graphs see Business Development Hurdles for Professional Services Firms
National Project Management KPIs
Overall, a vast majority of firms reported having moderate to high accuracy and visibility of project status reports. As expected, this is where most firms excel. They get project management and they live it every day. Although it is a little striking that given that most firms use some system or another, they’re still lacking confidence in the reporting (are they managing it outside of their system?) and that the right people have the right visibility, which should be easily remedied.
The lack of maturity of project management disciplines – more than 75% saying it’s only somewhat mature – shows that there is a significant need for an increased focus on this critical business culture – especially as competition continues to advance and the leading way to increase profitability will be through better project management.
One of the biggest challenges from a retention, hiring, and training perspective is developing and nurturing an appropriate and sustainable project management training program. Most project managers in our world are senior technicians who will flounder without training. Only 54% of respondents said that they felt they had qualified project managers. This is something that can easily be remedied with increased training and support.
Another interesting statistic on the project management side is that on average, 35% of revenue can from a firm’s top 3 clients. In other words, clients are ruling the roost. If you’re in this situation, what are you doing to care for them? What are you doing to diversify your client base? What happens if one of those clients walks tomorrow? While it’s great to get repeat business, it’s dangerous to have too many eggs placed in one (or three) baskets.
For detailed graphs see Project Management and Impacts on the Bottom Line
High Performing Firms
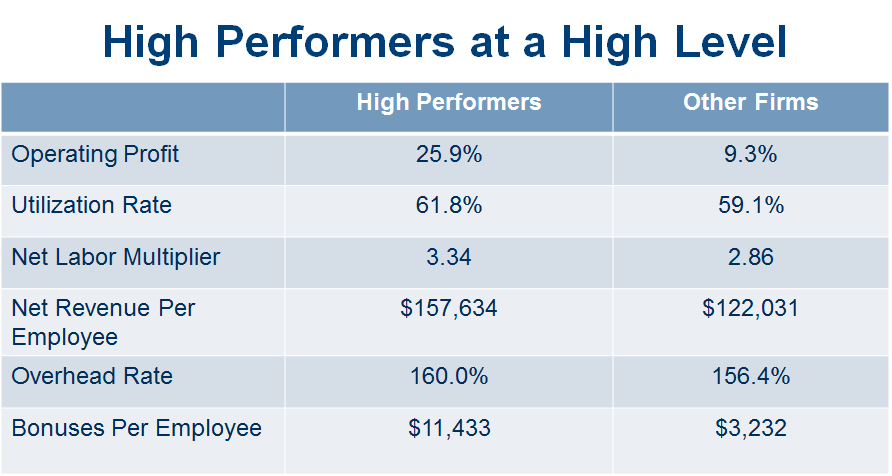
Now for some uplifting news, the Clarity Report historically defined high performing firms as those with at least 15% operating profit and a Net Labor Multiplier of 3.0+. However this year that means that 25% of firms are now considered high performers meaning that they are running more efficiently and making more informed business decisions.
The Presentation
[slideshare id=53473838&doc=deltek-clarity-houston-151002180739-lva1-app6891]